REMINDER: Our weekly Special Presentation Q&A is on Tuesday, Oct 6 at 12:30 ET. Please click here to register and ensure you receive the recording.
 What has our Product Development team been up to? Well, we got a tantalizing sneak peek in Friday’s “Special Presentation” titled, “The Missing Key To Your Trading Success.” It’s a brand new product called ROBOTRADER that marries your VectorVest Tools and your Brokerage account. It will allow you to carry out your trading plan seamlessly and automatically. Watch the Special Presentation and then join me Tuesday, Oct 6 at 12:30 ET for our regular weekly Q&A. CLICK HERE TO REGISTER.
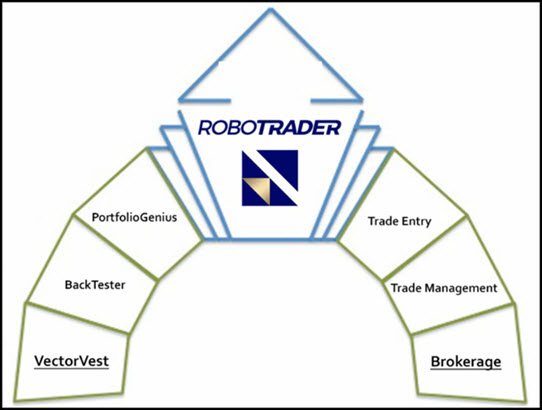 RoboTrader uses the Portfolio Genius to tell you What to Buy, When to Buy and When to Sell. It tracks all of your Brokerage activity. RoboTrader generates a list of suggested trades for your review, and at your direction, sends those trades to your brokerage account. Send the whole list, or cherry pick.
Webinar Highlights. As always, we’ll analyze market conditions on Tuesday, answer your questions and do some stock analysis for trade ideas.
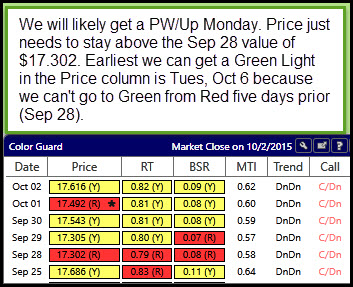
Here’s why you should expect a Primary Wavy/Up Market Signal tomorrow, Monday, Oct 5. The price of the VectorVest Composite (VVC/CA) is currently at $17.61. It just needs to open above $17.30 and stay above that level, which was the closing price 5 days ago on Sep 28.However, we can’t get a Green Light in the price column until Tuesday at the earliest. That’s because of the Red Light Sep 28. We can’t go to green from a red light five days earlier.
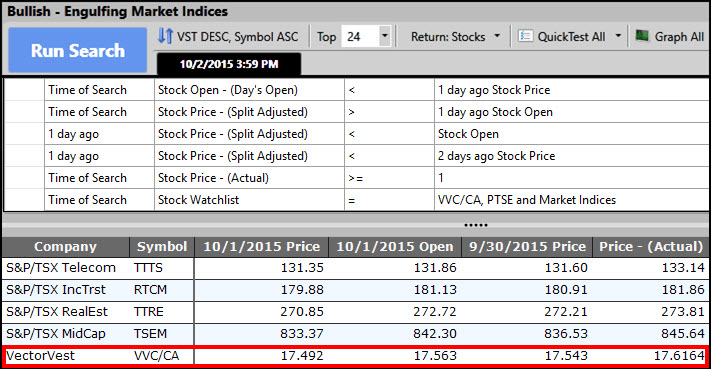
 Caution is still advised, however we should expect Friday’s Bullish Action to continue, at least for awhile. A bit of technical analysis suggests the market should move higher early at least at the start of next week. First, we got a Bullish Engulfing candlestick pattern our VectorVest Composite Price (VVC/CA), the arithmetic index of our total Canadian market. From the search below, you’ll notice four other major indices also got a Bullish Engulfing candle – Telecom, Income Trusts, Real Estate and MidCap stocks. Note: The stocks that comprise the Telecom, Income Trusts and Real Estate indices are found in the WatchList section of the Viewers tab under TSX Capped Indices. The TSX MidCap stocks are in the TSX WatchList.
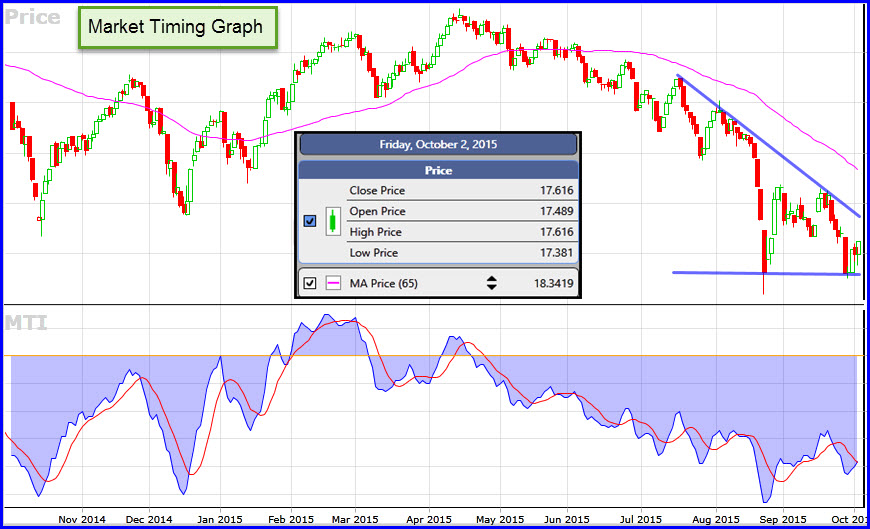
Second, the MTI is rising from a recent low of 0.57. Historically when the MTI breaks below 0.60 we can say the market is near a bottom or at least ‘searching for a bottom’.
Another indication favouring a rising market early next week is that all the major U.S. indices finished higher Friday with bullish candles as well including the SPY, RUT, DIA, QQQ, and VVC. However, the U.S. indices are facing nearby resistance overhead, so again, caution is advised. Be ready to take profits early and minimize losses if the markets turn lower.
Finally, we have a Wicked Wedge pattern in our Canada Market Timing Graph. (Search VectorVest Views U.S. for more information about the Wicked Wedge). Last week the price of the VVC/CA bounced off the floor of the wedge (support). There is still some room for the market to move higher early next week before resistance at the upper trendline of the wedge as shown below. Once we hit resistance, look for either a breakout to the upside or a retracement back toward the support floor.
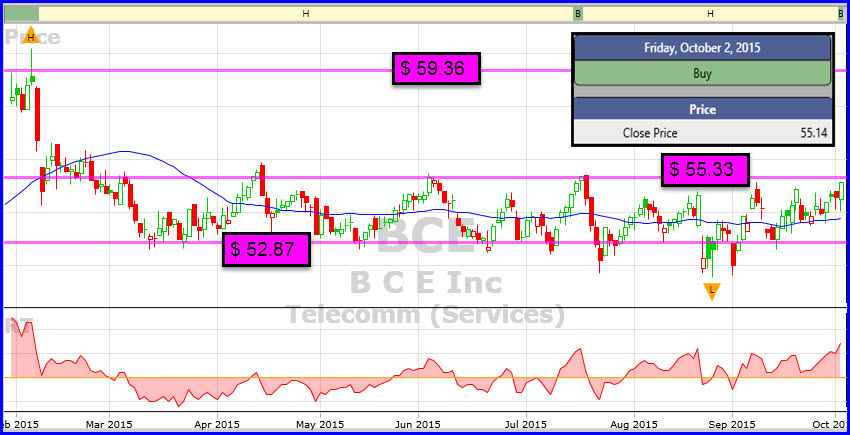
VectorVest guidance is to remain on the sidelines until we see Green lights in the Price column with follow through. However, it’s important to have your WatchLists ready. Your can find some solid candidates by running the Bullish Engulfing Pattern search from the Searches – Candlesticks. Several former leaders are returned including Stella-Jones (SJ), CGI Grp (GIB.A), Ritchie Bros (RBA), CNR and Noblis Health (NHC). The New Buys search returns Amaya (AYA), up last week on positive news, several gold/silver stocks and a stock that I’ve chosen to highlight in a case study below, BCE Inc (BCE). Remember, the Telecom Index had a Bullish Engulfing Pattern Friday, and BCE is the top VST stock in the index right now. It also had a Bullish Engulfing Candlestick on Friday, and it is a new BUY.
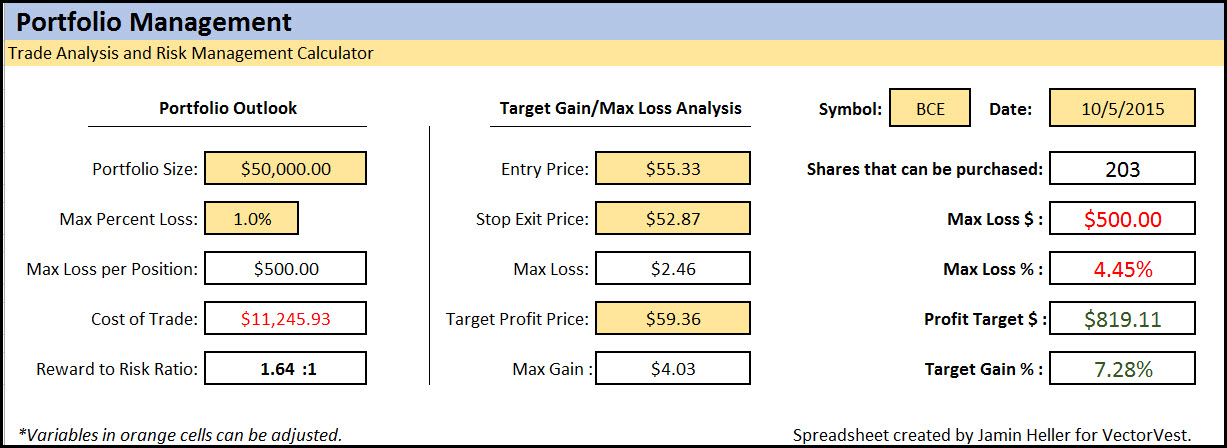
CASE STUDY. BCE makes a great case study for using Jamin Heller’s new Trade Analysis and Risk Management Calculator. It has acceptable fundamentals and pays a 4.72% Dividend Yield. Using technical analysis on the graph, you can determine 1. The optimal entry point. 2. Your Stop Exit Price to limit your risk. 3. Your Profit Target, a level where price is likely to get to and where you’ll be happy. Using graph analysis to get initial numbers for the calculator, we used the calculator to do some ‘what ifs’ to get an acceptable Reward to Risk Ratio. The Graph and the Calculator below show the analysis and final numbers for our study.
The Trade Analysis Calculator below showed that on a $50,000 Portfolio using Dr. DiLiddo’s 1% risk rule, we could buy a maximum of 203 shares at a cost of about $11,245. You can decide to buy fewer shares if $11,245 is too high for your overall portfolio balance. You just need to lower your portfolio size or your Max Percent Loss. Our final numbers in the Calculator below shows an acceptable but not ideal Reward to Risk Ratio of 1.64:1. This is a 7.28% potential gain with a maximum 4.45% loss, perhaps a reasonable approach in this volatile market.
DISCLAIMER: The information contained in this Blog is for education and information purposes only. Example trades must not be considered as recommendations. You should always do your own analysis and invest based on your own risk tolerance, investment style, goals and time horizon. There are risks involved in investing and only you know your financial situation, risk tolerance, financial goals and time horizon.
Presented by Stan Heller, Consultant, VectorVest Canada


Exceptional post Stan. Excellent info as to where the mkt is now but also the note of caution. Thx to you and Jamin for helping us to become smart and successful investors.
Thanks Mike. It will be another interesting and likely somewhat volatile week.
Another terrific post and great help again – Thanks Stan and Jamin
I have bought a little bit of DOL today and have used the Portfolio Management Calculator to determine my Position Sizing as well as for setting my Profit and Loss Targets
What a great tool
Cheers x 3
Barry
Thanks Barry. What I love about Jamin’s calculator is the complete control it gives you over your trade. All the Best.
Hi Stan & Jamin,
This Portfolio Management – Trade Analysis and Risk Management Calculator looks like a great tool. It is slightly different than the one previously received last week. This one has Cost of Trade & Reward to Risk Ratio added. is it possible you could send me this revised one?
Keep up the great work!
Thanks!
Ronnie.
Hi Ronnie, Yes, new and improved. The new version is on its way to you by email. Thanks Ronnie.