The Toronto 2-Day Seminar last weekend was a tremendous learning experience for seasoned VectorVest investors and new investors alike.
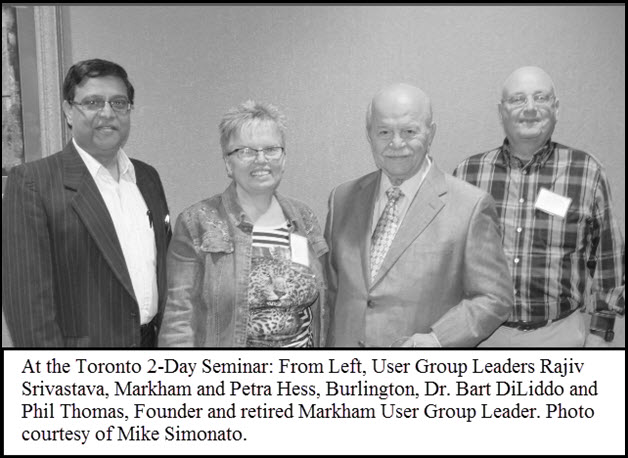 Subscriber William L. wrote, “It was great to meet you again at the Seminar in Toronto and to attend the insightful presentations from you and your colleagues, Angel Clark and Jim Penna. I learned something new every hour. It was a particular pleasure to meet Dr. DiLiddo and listen to his convictions on Gold.”
What attendees learned, one example:
Use trendlines to identify trading opportunities and to lock in profits
- Get in the habit of drawing trendlines on your charts to identify trading opportunities
- The Extended Line drawing tool remains on the chart and updates daily
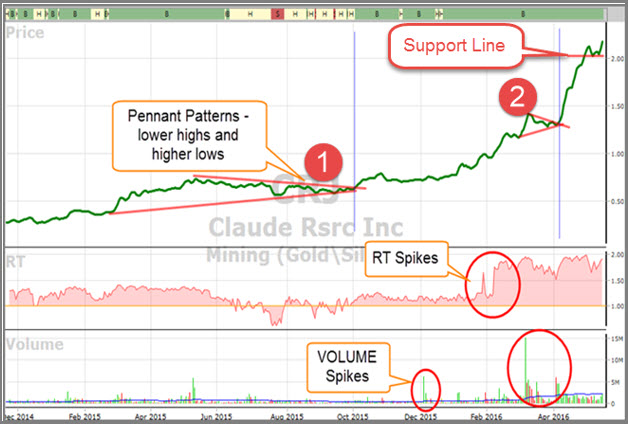
- Dr. Barbara Star’s favourite charting method: Place a simple 3-MA on your chart and remove price. With less ‘noise’ than candles, it makes it easier to identify trendlines and support and resistance as shown below.
- Spikes in Relative Timing (RT) and Volume indicate a change in buyer and seller sentiment as shown in the graph below.
When should you use Split Adjusted in your Search Criteria? Friday’s SOTW Special Presentation was titled, To Split or Not to Split. VectorVest supports two types of stock price: ‘Price – Actual’ and ‘Price – Split Adjusted’. Have you ever wondered what they mean and what is their proper use? Join us tomorrow, Tuesday, May 17 at 12:30 a.m. Eastern / 9:30 a.m. Pacific during our SOTW Q&A. We’ll review the rules and answer your questions. We’ll also look at market conditions in Realtime and study a few leading stocks. Click here to register if you haven’t already done so: REGISTER NOW. Can’t attend tomorrow’s live event? Register in advance to get the replay as soon as it is available.