Our Founder, Dr. Bart DiLiddo has often said, “I believe a stock’s price pattern is like its DNA…its past behavior reveals what you should expect in the future.”
Too often, however, investors clutter-up their graphs with too many technical indicators, often creating mixed signals and confusion. To learn how one of your fellow VectorVest members is using VectorVest indictors with considerable success, please join us this Saturday, May 7 for another International Online Forum. If you haven’t already done so, click here to REGISTER NOW FOR SATURDAY’S ONLINE FORUM.
The webinar starts at 11:00 a.m. Eastern / 8:00 a.m. Pacific. I realize this is early morning for some, especially our VectorVest friends in Australia, however, please note that as long as you register in advance, you will receive a copy of the replay as soon as it is available.
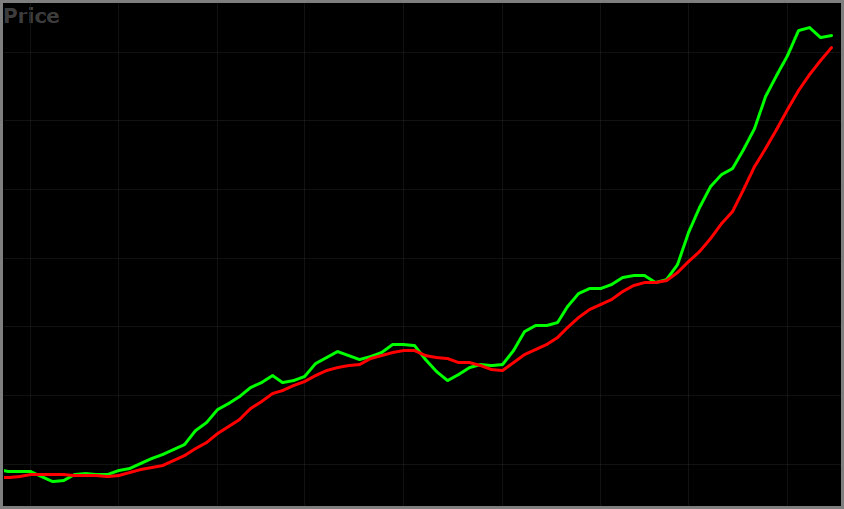
Just look at the simple chart below. Ask yourself, Could I have made money trading these cross-overs? Then join us Saturday to see how Petra Hess, our Burlington, Ontario User Group Leader, is doing it. Petra will deliver a special guest presentation titled, Why More is Not Better When Using Technical Indicators.
How well can it work? After learning about Petra’s 3/8-EMA crossover trading system during our December Online Forum, Margaret B. of Grande Prairie, AB decided to give it a try with some modifications and buying only high VST stocks. Margaret wrote me last week saying,
“Today was a milestone: this morning, April 27, 2016, just after the bell opened, I was up 100.60% in my Margin account in 4Months! My RRSP account did very well also at 28.73%. I have never felt so relaxed and trading has never been so easy! Thank you VectorVest, you have made a tremendous difference in my life and in my future!”
Which one or two indicator’s work best for your investment style? Let us know with a quick comment in the chat box below.
So, join us Saturday at the Online Forum to learn more.
Wishing you safe investing.
VectorVest Canada


daily charts with 5 & 8 SMA on price confirmed with RSI rising above 60 and selling when RSI falls below 40
Hi Gleason, Thank you for this great information. Congratulations on having a specific trading system for entries and exits.
I add value and EPS to Petra’s chart and I check the chart each night so if the is something unusual then I can get out and keep any losses manageable. First quarter this year up 17% + dividends. Thx Petra and Vector Vest:)
Thanks for those insights Mike. The methods and comments shared by you and Gleason are valuable and greatly appreciated. I hope we get a lot more for everyone to consider.
I use the star with DPO (9/20)to filter my chosen accounts and use the Hess curves the night before to confirm a buy or a watch list entry.
Fantastic Leslie! Thank you for sharing your methods and strategies with everyone.
I am also having success with Petra’s 3/8 EMA crossover with Top Vst stocks since the last confirmed up. Love the simplicity of the 3/8 that I have started using with all of my portfolios. Thank you so much Petra.
Great to hear Neil. Huge benefits in following a trading system. Thanks for commenting.