 I received a few requests this week for the slides of our Monday SOTW Q&A Webinar in which we reviewed Lester G’s contest winning-trading system. So, I decided to attach the slides here in case others would like to see them again. I’ve added four graphs to the slides, a sample the many graphs we studied during Monday’s webinar. People said they liked the Winners and Losers analysis slide. And they said they learned a lot from the way we studied the graphs of Lester’s biggest winners, the 100%, 200% and 300% winners, and his losing trades, of which only four were losses of greater than 20%.
If you missed the live webinar or just want to watch parts of it again, here is the recording link: https://attendee.gotowebinar.com/recording/1912002707227348481 The recording will be available until Monday, March 16, 2015.
All Midas Touch Stocks Are Not Created Equal. We know that all Midas Touch stocks are in a short term uptrend at the very minimum. That’s the definition of a Midas Touch stock. It requires three unique Moving Averages hitting new 3-month highs in order to make the Midas Touch WatchList. The WatchList is updated at the end of each trading day. So, all Midas Touch stocks are in a strong uptrend, and they all have the potential to continue and deliver solid gains from there. However, to find the very best candidates for potentially big winners, I find that you have to widen the view.
Study a 1-Year Graph. We know all midas stocks look good on a 3-month, midas touch graph. That’s your first point of reference. However, I suggest you also look at a regular, daily 1-year graph to spot the best patterns. As we studied graph after graph of Lester G’s biggest winners and losers, it became easier to see which stocks had the greatest potential to deliver those big gains. They are the ones with the smoothest, least volatile price patterns leading up to the buy point as a Midas Touch stock.
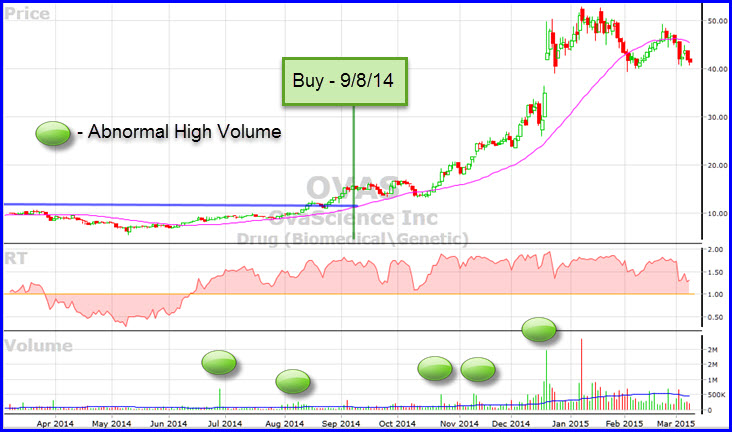
Take the OVAS graph below for example, a 216% winner for Lester. The upper graph has price and a 40-day MA, and it shows the date when Lester G. bought the stock in his backtest. The sub-graph shows volume and the 50-day MA of volume. This makes it easy to spot the abnormal volume spikes that often precedes price uptrends. Institutions are buying the stock. It works the other way too. Notice that OVAS pulled back in January after a large abnormal volume spike on a down day followed by a few more up volume days but several more price declines on high volume.
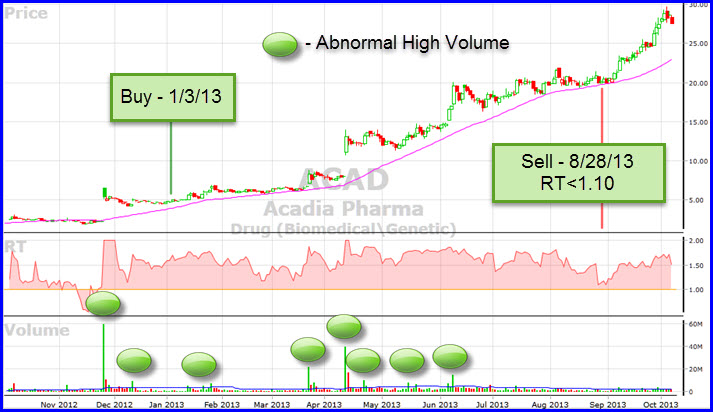
What to look for. Lester’s biggest winners almost always showed smooth, rising price patterns at the time of purchase. They were purchased soon after they broke out of lengthy price channels or consolidation patterns. RT had recently risen above 1.0 and was now well above 1.10 at purchase.
Here’s Lester’s biggest winner, a 327% gain by ACAD. Lester’s trading rules say sell when RT falls below 1.10, in this case, ACAD pulled back to the 40-day on 8/28/13 and then resumed another nice uptrend although you can see that volume was slowing the last month or more before the sell date.
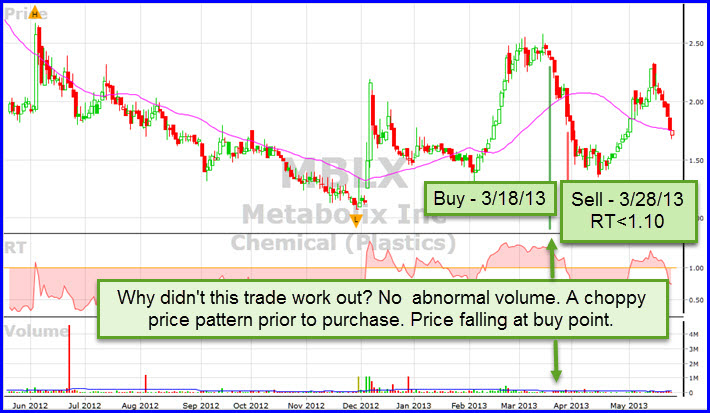
Why didn’t MBLX work out? As you can see from the 1-year graph, MBLX was entering a volatile phase after a lengthy downtrend. There was no support from abnormally high volume on the up days. Price was extended from the 40-MA. Finally, price actually opened lower and fell on the date of purchase.
Here are the slides. I hope you find the information interesting and helpful to your trading.
Submitted by Stan Heller, Consultant, VectorVest Canada
March 11, 2015
[embeddoc url=”https://vectorvestfr.azurewebsites.net/cablog/wp-content/uploads/2015/03/SOTW-March-9-2015-1st-Place-Analysis-and-Graphs1.pdf” viewer=”google”]


Thx Stan. These will be very helpful