By Petra Hess, User Group Leader, Burlington, ON
Since I started to manage my own portfolio years ago, I have searched for an easy to use but consistent way of handling both my short and long-term trading positions. What I wanted was a good stock analysis and portfolio management system and some simple indicators to help me trade my positions efficiently. Vector Vest, in my opinion, is the best program to give the user everything they need including fundamental analysis, technical analysis and the ability to search and sort according to user-defined parameters. The epiphany came when I started using the 3 EMA and 8 EMA crossover points as indicators to trade into and out of positions with the Vector Vest program.
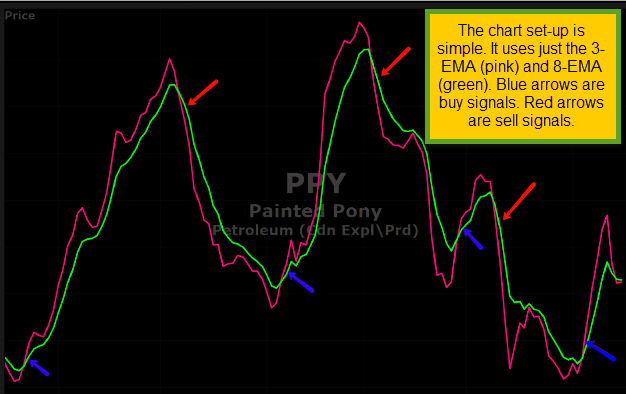
Above, you can see the daily chart set up that I use for the 3-EMA and the 8-EMA crossovers. It’s very basic. I take all the other moving averages and the candles off the chart. I look only at the two moving averages. A buy signal is triggered when the 3-EMA crosses above the 8-EMA. It is important that they have crossed and not just touching. A sell signal is triggered when the 3-EMA crosses below the 8-EMA. This simple technique be can be applied to any chart. You can check your positions or watchlist in just a few minutes each evening. I have developed a watch list of 25 stocks in Canada that I trade regularly. I have found this strategy to be very profitable. In particular, it seems to be an especially effective way to trade ETF’s.
Our Burlington VectorVest User Group has several end-of-day subscribers. As leader, I set out to build some Model Portfolios with the group that would be prudent and easy to manage using the end-of-day program. The search I like to use is ‘Prudent Performers’ within the UniSearch Tab, but I change the sort to VST+YSG DESC from VST DESC. Our ‘sell’ criterion is set at VST< 1. We ran this search at our meeting Jan 2, 2014 and ‘bought’ the top 10 stocks at the open Jan 3. Since then, one stock was delisted due to a buyout. We sold it and replaced it with CNR in February. Shown below is how the portfolio has performed including dividends as of market close November 17th. The portfolio to date is up 29.52% since inception Jan 3, 2014.
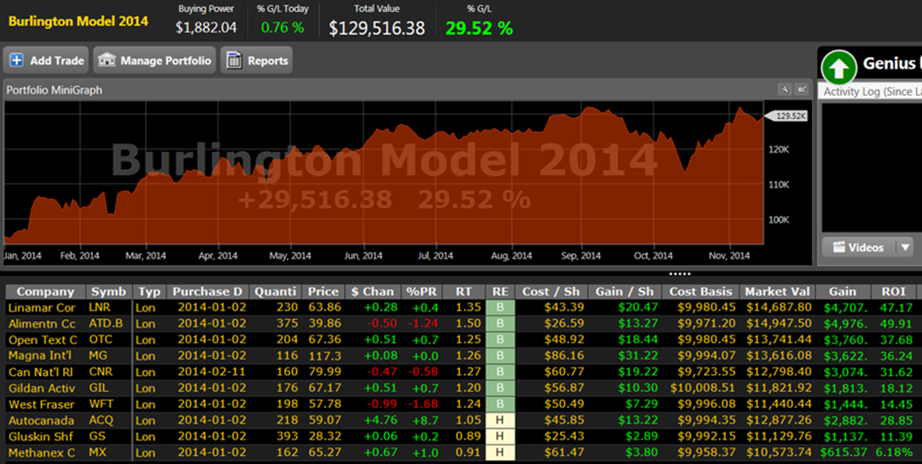
A little hard to see on graph, but LNR up 47.17%; ATD.B up 49.91%; OTC up 37.68%; MG up 35.24%; CNR up 31.62%;GIL up 18.12%; WFT up 14.45%; ACQ up 28.85%; GS up 11.39%; and MX up 6.18%.
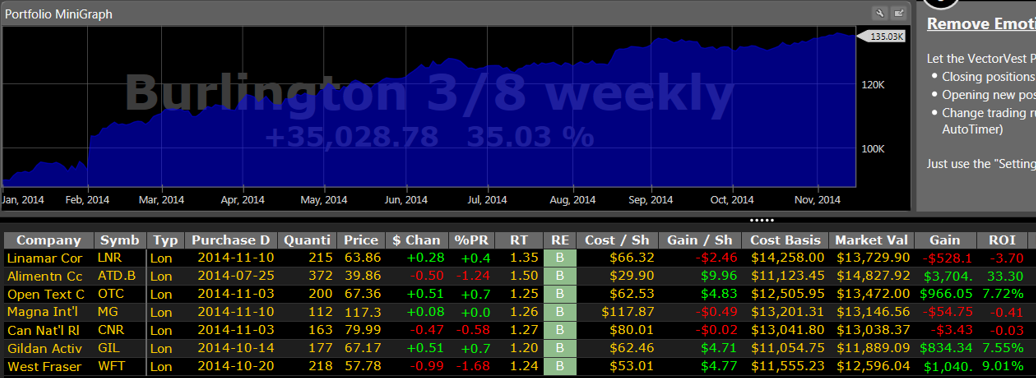
In August, I was looking for ways to improve the performance of this portfolio with just a little time spent each weekend to manage positions. I went back and manually entered trades once a week using the 3-EMA/8-EMA crossovers on a weekly chart for all 10 stocks in the portfolio. I only checked the charts at the close on Friday of each week. I made the necessary trades that at the open on the following Monday. I decided that if I ‘sold’ a stock using the ‘3 crosses below 8’ criterion, I would not replace it in the portfolio unless the VST had dropped below 1. If VST did fall below 1, I would look for another candidate. However, if the VST remained above 1, I would just watch the stock on the weekly chart and buy it back when the 3-EMA crossed above the 8-EMA. Below is this modified portfolio as of November 17. It is up almost 5% over the buy-and-hold portfolio.
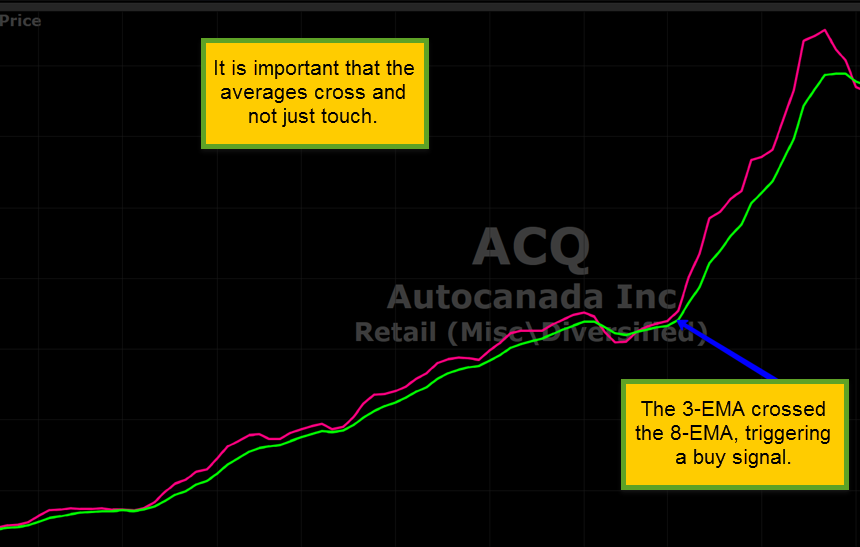
My criterion to buy is that the 3 EMA needs to cross above the 8 EMA and I need to be able to see the cross. I do not do anything if they only touch. See the example below.
This simple trading technique has worked very well for me on short-term positions using daily charts. I now manage my longer-term positions using the weekly charts. Be aware that there will be daily charts that give you far too many buy and sell signals where this technique is not suitable. However, I have found it works well on the majority of the charts.
VIDEO LINK: Here is a link to a video tutorial to show you the set-up for your chart and how I use the 3-EMA and 8-EMA for my own trading. You may click on it or copy and paste into your internet browser.
http://www.screencast.com/t/lo3dT8DTyQ
If you have questions or need clarification on the 3-EMA/8-EMA Crossover, you can contact me at [email protected].


Thank you Petra,
I like your idea of having a strong watchlist to play using defined buy/sell parameters. I am a strong advocate of simplicity and this approach makes it very mechanical. I will do some research on my own. Thanks for sharing!
Sincerely,
Jake Pattinson
Hi Jake,
This is a very simple system to use and on a weekly chart it removes all the daily volatility.
Take care,
Petra
Hi Petra,
I set the graph up on a daily basis. Are you recommending it be used on a weekly chart? For some reason, I couldn’t get your video to play in the event it was described in there.
Also, you can set up the crossover in Protrader and then add 1 line to your favourite search. Unfortunately, the defaults only allow 4EMA and 9EMA.
Thanks, Jake
Hi,
I use it on daily for shorter term swing trades and then on the weekly for core holdings. Yes I know that VV only allows me the 4EMA and 9 EMA in a search. Try the video again if it is a little rough in the beginning it will smooth out after about 10 seconds. If not email me [email protected] and I will send you a direct link.
Petra
Thank you so much!
Jake
Petra, thank you for sharing this straightforward, well thought out technique. It looks like a great alternative to a long term buy-sell indicator we have discussed locally that involves two and thirteen week moving averages of the market or individual stock stop prices.
As it turns out we have a Regina user group meeting tomorrow and I look forward to sharing your suggestions with our group at the meeting.
Wishing you continued investing success!
Irwin Blank
Hi Irwin,
Please if anyone has any questions on this at your group meeting make sure they send me an email and I will help them. This a very reliable way to trade a lot of charts.
Have a great day!
Petra
Thx Petra, I really enjoyed learning about this strategy and the simplicity behind it. The new Blog capability is opening up the VV community even further and providing insights into the various user groups. Unfortunately, the closest user group(s) to my home base are more than 2 hours away hence I don’t attend in person – so I am highly reliant on “cyber” communications and networking to improve my investment performance.
Hi,
If I can help you with anything at all just send me an e-mail. I agree this new blog is a great way to share ideas right across Canada.
Take care,
Petra
I am a member of Burlington Group. I use 3/8 graph and is very simple to use.
This is the great invention since MACD! Petra looks at this 3/8 graph once a week on Friday.
It saves lot of time. Thank you Petra.
Shashi Karandikar
Hi,
Thank your for the kind words and thank you for being part of our group!
Petra
Petra
This is so simple, It makes me very confident in managing the portfolio, thank you so much.
Ali Mohatarem
Hi Ali,
Thank you for being a member of our group and for trying out this technique. It works very well on most charts and we ill discuss this further in future meetings.
Take care,
Petra
Thanks Petra.
What a great explanation and such an easy plan to follow. The simplicity is fantastic. I am almost finished “cleaning out” my portfolios so that all will eventually conform to the weekly 3 and 8. I am using this for most of my trades now and see it as a stress reducing plan, involving fewer trades that I can follow for retirement which is I hope getting closer. I also see more and more of my “smarter than me” friends adopting it since you first began talking about it.
I was very impressed with the Burlington Portfolios’ performance all year but the addition of “management” using the 3 and 8 significantly improves the performance and really puts icing on the cake. None of the US VectorVest portfolios have come close to this in 2014. In Canada Jake’s is also excellent and the VSA model Portfolio has done well overall. However the VSA does not have a nice lower left to Upper right trend but rather three relatively flat steps one of which one stretched all the way from March to October.
Tom
Hi Tom,
This is certainly a stress free way to mange your trades. I agree with you on Jake’s portfolio. Thank you for supporting the Burlington group.
Petra
Great article Petra – Thank you for contributing. I checked it against my current holdings and it makes me feel much better as some of my favorites had started to fall off.
Hi Mike,
Thanks for the note. This blog is a great way to exchange ideas. Happy you found it useful.
Petra
Thanks for posting a great looking strategy. Did you use the Vector Vest MACD site and how did you enlarge it? Also, what time frame did you use in your graph? Thanks.
Hi Florence,
It is all explained in the video. The link is in the article. This has nothing to do with MACD. I used the PPY example on a daily but longer term holds are done on the weekly. This is just the 3 and 8 EMA’s on the charts. My email is in the article if you need more help.
Petra
Hi Petra:
Thanks, I missed that link and it explains the set-up thoroughly, even I might be able to do it.
Florence
Help is here if you need it Florence.
Petra
Thank you for taking the time to share, Petra. I really appreciate the simplicity of your approach.
Hi,
It is simple but very effective way to manage positions. Thank you for taking the time to visit the blog and read it.
Petra
Hi Petra:
An interesting article with another approach using the EMA’s on a weekly basis. Many thanks for sharing this.
Don Fanstone Kitchener Waterloo
Hi Don,
This has been a very easy to apply strategy that works well a high percentage of the time.
Thanks for the comments.
Petra
Thank you Petra for sharing to us your technique.
Looking foward to test your technique.
I live more than 200km of the closest VV Group, very good idea of sharing over Internet.
Mfinab,
Thank you so much for visiting and taking the time to read my article.
Petra
Wow ! Thank you very much , Petra, for sharing your ideas here.
I will always be indebted to Stan Heller for helping me out personally and guiding me in the right direction with his tips on the MTI, ADX and OBV – as examples, and am always looking to improve my skills and learn from other more-than-capable investors. I try not to miss any of his “live” webinars and I know he always speaks highly of you and Jake
I will be adding the “3 & 8 EMA” graph setup to my list of favourite graphs and look forward to seeing how it fares with the others, but I am keen to follow it along using it just weekly on some core stocks and daily on ETFs which I enjoy working with – particularly because you don’t have to concern yourself with EPS, GRT, GPE , RV and RS to name a few key criteria and yet still manage some decent upside potential
I must say that I am particularly impressed with your graph layout in that you don’t seem to need to deal with the actual numbers found in the graph control panel and that you do it all purely by visualization
Thanks again Petra – and I hope we can stay in touch
Barry
Hi,
Please contact me if you need any help or clarification.
Petra
Hi,
Thank you for taking a look and the signal is just a complete cross of the two averages.
Petra
I have been playing around with your 3/8 and love its simplicity.Thanks for sharing it. How do you handle a period of chopiness ? The lines are very close and jiggle across the graph. Do you stay on the sidelines until you find one of the stocks in your list start to move . I am using a US list sorted by industry by 5 day RT . I have added a 5,35,5 MACD which I will refer to if the 3 crosses below the 8 . If the MACD remains steady above the trendline I have stayed with the stock as checking back I have observed the cross over often reverses after a few days if the VST holds relatively steady.
Hello,
Please let me know your results.
Petra
Hi Petra,
Thank you for your article on the 3EMA and 8EMA crossover. I was just thinking to myself that i need to find a simple way to manage my portfolio and Voila! there was your article. The great thing about it is you can use the weekly chart for long term positions and the daily chart for the rest. Bravo! I will definately be using this approach going forward. Thanks again.
Cheers,
Dave Keller
Hi Dave,
The members in my User Group that have applied this, have found it to be very effective.
Petra
Loved your 3 & 8 ema article. Are you using it in conjunction with one of VV timing market timing systems or on its own?
Brian
Hi,
I use this only as an indicator to get in or out on the weekly crosses. It is not combined with market timing. Please let me know if you have more questions.
Petra
Hi Petra:
Thanks for sharing this easy to follow strategy. Have you used it in the US market?
Claire
Hi Claire,
Thanks for reading the article. I have used this for US ETF’s but most of my stock trades in the US are short term swings. Take a look at yhe stocks you like and see how the 3 and 8 EMA has worked in the past on them. That is a good way to judge.
Petra
A great article…thanks.
1. Short term v long term…from your prospective, what make one different from the other…and when do you switch (assuming that you do)?
2. You may not wish to, but let me try any way…what are your 25 stocks that you have put in a watch list that you trade regularly? Yes,I like your modification to Patent Performers: & Jake’s
3. Not too sure if you are an options trader….it seems (not yet researched) that the cross overs may be a good time to get in / out of calls. Any comments?
Petra: Keep up the good work! RC.