By Stan Heller, Consultant, VectorVest Canada
 We’re spoiled with VectorVest’s AutoTimer Genius by the ability to run several BackTests in a reasonably short period, easily changing our test dates, market timing signals, search criteria and money management strategies. We can change from Gain/Loss to Trailing Stops in the blink of an eye and run several tests in short order. However, there are times when it’s beneficial to run a manual BackTest. That allows you to stop the test at will and look at market timing information and even stock charts before you buy or sell.
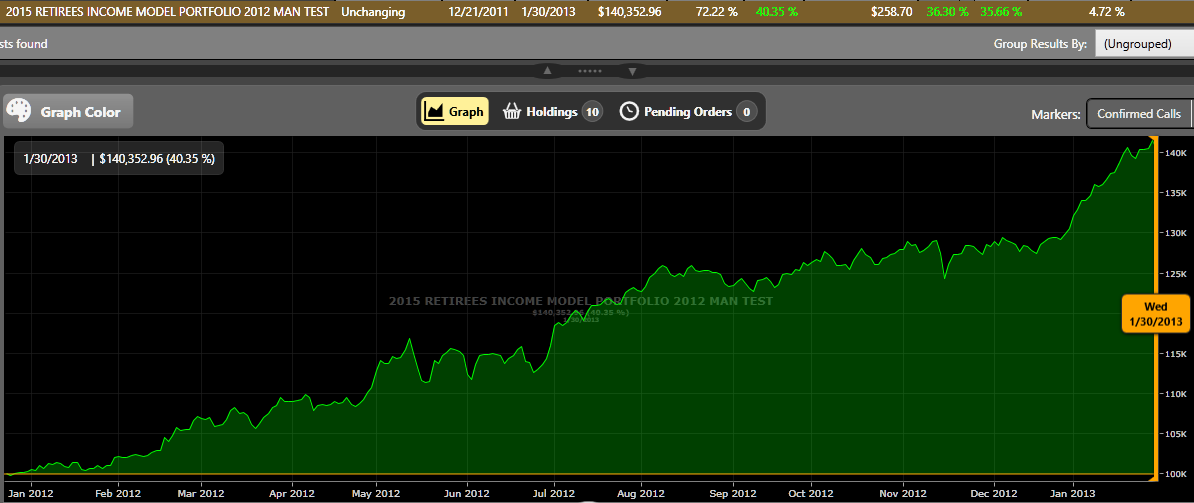
For example, I ran a manual backtest Saturday that improved automated backtest results sharply over a 13-month test period during 2012. It was about 36% ARR to 17%. Now 17% ARR in the difficult year of 2012 is pretty good. But 36% is better. The drawdown was exceptional at just 4.72%. I purposely chose a tough market for a solid test. What was the secret?
Well, using a manual BackTest, I only purchased stocks when the following conditions were met:
- The MTI was rising off a bottom, the Primary Wave was UP (PW/Up) and there was follow-through the next day as evidenced by a green candle. PW/Up is VectorVest’s fastest signal. In choosing it, I was mindful of Dr. DiLiddo’s words in recent essays and Chapter 20 of his classic green book, Stocks, Strategies and Common Sense. He basically says more often than not it’s beneficial to buy as close to a market bottom as possible.
Further, with the manual BackTest I was able to use technical indicators to determine ‘When to Sell’. I chose to use a weekly graph. So, after each new stock was purchased, I pulled it up on a weekly graph and determined when to sell. I decided my exit criteria had to be simple, visually clear and unfudgable. I also wanted a fairly wide stop, appropriate for a long term, dividend portfolio. So, a sell signal was given whenever price crossed below the 40-week MA (moving average) and the action was confirmed with RT<1.0.
Personally, I love the Autotimer Genius for BackTesting. It makes it easy and fast to run several tests using different criteria. And it’s accurate. There’s no ‘unintentional’ fudging when you can look at the right edge of the graphs. But sometimes you want to test out a unique market timing system, using MTI bottoms and tops for example. Or you want to use technical studies in graphs for entries and exits. That’s when you’ll want to know how to run a manual BackTest. Important note: Once you know how to run a manual BackTest, you’ll see how you can combine both manual and automated by controlling the dates in graph mode.
Click here for the video. The video link be posted next week on our CA BLOG video library. However, if I’ve tweaked your interest, just click on the following link for immediate access: http://www.screencast.com/t/mFfP6Faf093
The video is quite a bit longer than usual, about 50 minutes instead of the 30 I intended, but I felt it was important to repeat the steps a number of times. Of course you can pause, rewind and fast forward through the video by clicking your mouse in the slider bar at the bottom of the screen.


A fantastic blog to be viewed over and over. It’s ahead of it’s time!
I have found this exercise to be a great learning tool. More testing to do, but it seems to level out portfolio volatility, especially when using VST stops.
Video is longer than usual, but well worth the time and effort. Thank you for posting Stan.
Thanks for your comments Eric. Glad you found it worthwhile.