With the recent selloff in the market, how do we prepare for the next rally? This week’s Special Presentation by Mr. Todd Shaffer, Manager of Research, provided a review of Bottom Fishing techniques and how candlestick patterns can provide early indications of reversals.
Tomorrow’s Q&A Webinar: Join me tomorrow at 12:30 ET for our regular SOTW Q&A webinar. We’ll study market timing graphs and how candlestick patterns and VectorVest’s exclusive market timing signals can quickly identify market bottoms and market turns. Not sure what Candlestick Patterns to watch for? I’ll show you tomorrow a quick method to set up a few Candlestick searches to look for reversal patterns with the overall market and several market indices. From there you can run your searches daily to identify those market turns. CLICK HERE TO REGISTER if you haven’t already done so. Registered investors will also receive an email with a link to the recorded webcast.
Avoid costly mistakes using the MTI graph. In last Monday’s Q&A webcast we reviewed the Market Cycle of Investor Emotions graph below. It’s a pattern that repeats itself over and over again with inexperienced investors and investors who don’t have a service like VectorVest to help identify the phases of the market. What happens is that investors become overconfident and continue buying as markets are overbought. As markets begin to fall, they don’t see it coming or they refuse to reduce risk by taking some profits and selling their weakest positions using pre-determined Stop criteria or one of VectorVest’s four technical warning signs. As the losses add up, they convince themselves they are long-term, buy-and-hold investors. Except that if the market continues to fall in a significant pullback or correction phase, panic and despair sets in, and then they sell. Often right at the market bottom. Folks, we’ve all been there. But now we have VectorVest to guide us through these pitfalls. A service that has historical reference points for identifying market tops and market bottoms.
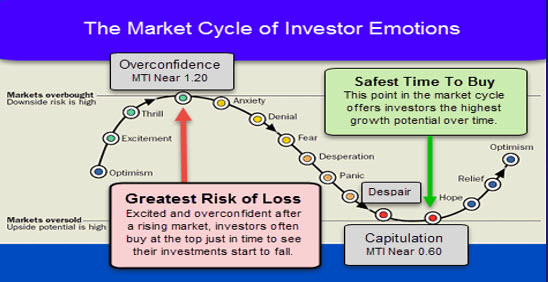
Here’s what the MTI graph was has been showing us:
Preparing for next week. Will the rally continue? No one knows for sure, but VectorVest guidance to Prudent investors is more bullish than usual when we don’t yet have a green light in the price column. Friday’s guidance statement in the Strategy section reads: Prudent Investors should get their shopping lists ready to buy stocks if the market moves sharply higher Monday. The reason Conservative to Prudent investors need to get ready to step back into the market early is that we’re coming off a historical market bottom. The MTI got as low as 0.46 Monday morning before the market started to rally. Dr. DiLiddo calls this the ‘explosive rally’ phase of the market. News events aside, there should still be some room to run in this market phase. We should have our shopping lists ready. In tomorrow’s webinar we’ll show which Bottom Fishing searches have been performing the best since Tuesday’s Bullish Harami Candlestick pattern on the MTI and VVC/CA (VectorVest Composite Index). Time permitting, we’ll create a WatchList of dividend payers from five of our top dividend searches. I hope you’ll join me: CLICK HERE TO REGISTER