By Michael Wuetherick, P.Eng. User Group Leader: Red Deer Alberta April 7, 2015
Do you want to TURBOCHARGE your returns? Add some technical parameters to your UniSearch parameters and unlock some big wins!
Without doubt, one of the most impressive features of the VectorVest platform is the powerful UniSearch capabilities. Users are limited only by their own creativity and personal risk profile to create successful trading strategies. Combining the fundamental strengths of VectorVest analysis (i.e. RV, RT, RS, CI, etc.) with some technical indicators can deliver a solid, robust trading plan capable of delivering impressive results.
Over the past 6 months, the Red Deer UserGroup has dedicated a portion of our monthly meetings to taking an in-depth look at some key technical indicators supported by VectorVest through the ProTrader module. Specifically we have studied MACD, ADX, Stochastics, ATR, Bollinger Bands, OBV and Fibonacci theory. Many investors in our group reported a noticeable improvement in their trading success by incorporating some of these tools into the regular stock selection strategy.
At our last Usergroup meeting held on March 18th, 2015 we focused on “Putting it all together” where we tested a strategy I developed called the AXS Kicker Strategy that combines several key technical indicators and the power of the VectorVest stock ranking system:
NOTE: You will require VectorVest’s add-on ProTrader module in order to duplicate the technical parameters in the search screen. Call Support for a 2-week free trial 1-888-658-7638.
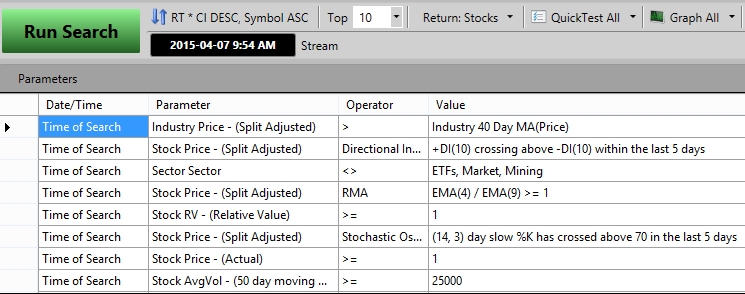
The key elements of this strategy are:
- Find stocks with a bullish ADX +DI(10) crossover above the –DI(10) within the last 5 days. The ADX indicator measures the degree or strength of the current trend. ADX values rising above 25-30 are considered to indicate a strong trend and support buying stocks with this set-up.
- Focus on industries and stocks that are BOTH exhibiting Bullish X-over of moving averages:
- Industry price must be greater than the Industry Price SMA(40)
- Stock price EMA(4) must be above the EMA(9). In the search I used the relative moving average (RMA) parameter available in the ProTrader to emulate Petra’s highly recommended EMA(3)/EMA(8) cross-over technique. The EMA 4/9 setting is the closest parameter available to Petra’s preferred setting.
- Look for stocks that have made a recent strong bullish move using a Slow Stochastic crossover of %K moving about 70% in the past 5-days. Stochastics are used to measure the short-term momentum relative to recent highs/lows. Stocks with Stoch(14,3) crossing 70% are in the midst of a powerful short-term upswing, yet still below the overbought situation when Stochastics dip below 80% from higher values.
- The sort criteria is RT * CI descending. This parameter combines the strength of the VectorVest RT signal and will move the “smoothest” stocks to the top of the list using the Comfort Index.
- The stop criteria uses the Average True Range ATR(3,15) which implies 3 times multiplier on the ATR(15). ATR is a useful filter to gauge the difference between market “noise” and statistically meaningful swings in price action. In using the 3X multiplier, only trades that are OUTSIDE +/- 3 standard deviations will trigger an exit.
- Market Timing is based on the Primary Wave system which does generate a fairly active trading plan with an average of 10-15 trades per month. However the best back-test results came from buying at or near the close so you won’t need to sit at your PC all day long, but you will need to be ready to buy at the close. In putting this strategy to work I typically run the strategy throughout the day and watch for a fade at the end of the market close (usually around 3-3:30 pm Eastern) and put on my positions just before the close.
Backtest Results: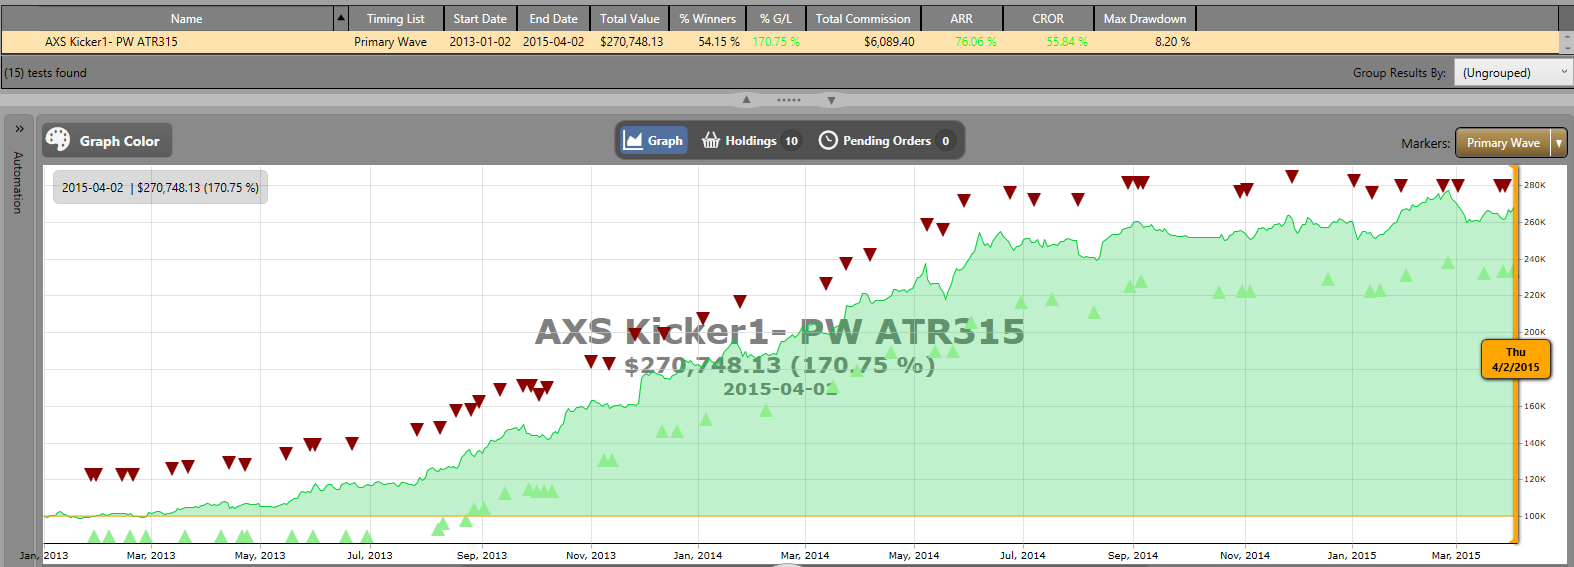
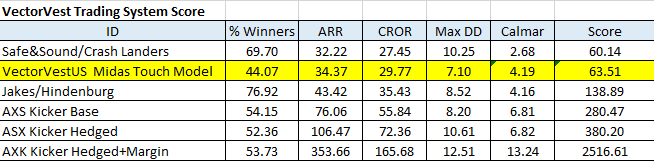
Despite the fast market timing and commissions costs, this system delivers huge ARR of 76.06%, CROR of 55.84% with a reasonable maximum drawdown of 8.2%. This search lends itself to BULLISH market conditions, but by combing the Primary Wave and 3XATR stops, it avoids the painful drawdowns and volatility we have seen in Canada since September 2014. I like to test all strategies on an annual basis to get an indication of how they will respond to different market conditions. As outlined below, this strategy didn’t work as well pre-2013 however still had positive results for each year except for 2011 when the market was weak overall. 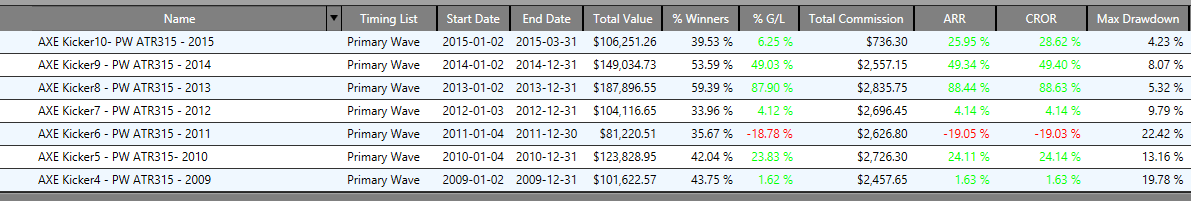
To further enhance the results, I added buying ContraContra ETF’s (sorted by RT descending) to hedge the portfolio on a change in timing. By using the 3X ATR(15) stop criteria, many of the long positions will ride through the market cycles, but when things get ugly they are sold and replaced with the ContraContra ETF with the highest short-term momentum. As you can see the results are very strong even compared to more prudent hedged strategies like Jake’s Patent Winners/Hindenburg and Safe and Sound/Crash Landers model portfolios.
For those of you who are really aggressive, including a 50% margin setting the results are downright explosive delivering over 350% ARR with only a 12.5% drawdown!! 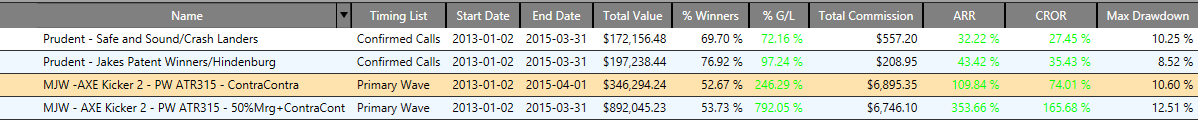
Using the VectorVest strategy scoring system, I get the following results for these three variations of the AXS Kicker Strategy:
I have been actively trading this plan in my margin account in 2015 and have had some big winners so far including MSL, ESP, NRI, XTC, MG, CLR, CFX and PHM, each delivering more than 10% gains.
While this trading plan might be too aggressive for some, hopefully it can spark your creativity to use the technical trading toolkit available in VectorVest.
May the trend by with you….
YOUR COMMENTS PLEASE: What strategies and market timing are you using? What stocks are in your Watchlist?
BACKTEST SETTINGS ATTACHED – Click on the little arrow at the bottom of the document to open a menu. You can choose to download a PDF or print a copy.
[embeddoc url=”https://vectorvestfr.azurewebsites.net/cablog/wp-content/uploads/2015/04/MW-AXE-Kicker-Backtest-Set-Up.docx” download=”none” viewer=”microsoft”]


Awesome info. Thx for sharing. SOTW, Colour Guard Report , Stan Heller, and posts like the above are all part of what makes Vector Vest so amazing. Thank You to everyone who works hard to help make us better investors.
Amazing work here Michael – and I am glad it is working for you, but being a big believer in the K.I.S.S. theory – this approach is way too much for me.
I am currently using all of the technical indicators that you have mentioned above with the exception of Fibonacci and in conjunction with RT, CI, Petra’s 3 > 8 EMA, Star Search and Stan’s MTI > MTI(8)
Now if we can only establish a new market trend in these oscillating markets
Thanks for your interest Mike and Barry! I hear you on the KISS principle but it isn’t really that difficult to manage.
I had originally developed this search to look for DITM long call option candidates, as this search tends to find several BIG winners especially on fresh Primary Wave UP calls. I found that using RT only often was getting me into stocks with near-term bearish divergence and therefore often seeing pullback shortly after buying. By adding stochastics plus the ADX indicators, the search will almost always eliminate stocks that are technically divergent.
The challenge in executing this plan only comes from the ATR stop as most trading platforms don’t support that function directly. To accommodate this I use the VectorVest portfolio manager to alert me for sell signals directly, and I use trailing stops in my trading platform that I review every couple of days to ensure it reflects the 3XATR. For many stocks a 3X ATR will be roughly the same as a 5-7% trailing stop loss, but you do need to chart the ATR and revise your stops regularly.
The stop criteria here is the key element for me as like so many others, when to sell and controlling emotions on the way down is a tough thing to manage. The beauty of the ATR approach to me is it takes a severe change in sentiment before you need to sell! Therefore keeping you into some of these solid stocks for a longer period.
Finally, in my actual trading plan I ignore PW up signals if MTI MTI EMA(8). Although I can’t backtest with the MTI rule, I can attest that my actual trading results are better than the model likely as I don’t enter trades in diverging markets. MTI is worth the price of admission to VectorVest all by itself!!
Good luck to all!! If anyone has any questions on this plan, please ask….I am happy to help out!
Hi I didn’t understand the last paragraph re Mti Mti8. I have a trading plan that all my tests show no losers and a 45-55% ARR I’m anxious to put into action I’m waiting for the MTI to fall to .60 or less as I am more of a buy and hold person due to being very busy with my business at certain times of year. My sell criteria is a weekly graph where price crosses below the40 ma. My buy signal is PW up if MTI below .6 or .5 would be the dream
Sorry Mike, that should have read “I ignore PW up signals if MTI is greater than MTI EMA(8)” Stan speaks to a simple moving average MTI cross-over, but the EMA(8) is slightly quicker and therefore I can adjust as required.
In studying the backtest results, I found many of the failed trades happened in and around the often quick PW up/down swings that often coincide with a declining MTI. I like to buy at low MTI as well but those situations are few and far between lately and therefore that timing requirement often will leave a strategy like the AXS Kicker out of the market. Regardless, the AXS on a buy-hold model will also find some big winners. For example, from the Dec.17th MTI low to current, this strategy had 8 winners-1 loser…..28.66% gain compared to the VVC-ca gain of 7.27%. Not bad!
I hope that helps, and maybe you should post your trading strategy with a 100% winning percentage….NICE!!
Oops…blew it again…not my day!
“I ignore PW up signals if MTI is LESS than MTI EMA(8)” In other words I am looking for the MTI to be at or above the EMA(8) before buying stocks. Conversely I start to tighten up losses on big wins and/or sell calls when the MTI starts reaching the Canadian historical peak at around 1.2-1.3.
Sorry for the confusion!
Hi,
Thank you for the excellent article. I am going to build thus search this evening and work with it a bit. It is great when everyone shares their ideas.
Take care,
Petra
Good luck….I hope there is enough information in the post for you to see if you can beat it. If anyone can its you Petra!! I hope you will share your improvements with everyone…or just me will be fine as well!
One of the key items to make sure is that you are buying stocks at the CLOSE of the market. This particular search will often find stocks that are just in the midst of a near-term upwards swing. Therefore they often gap up or open very strongly the very next morning. When you look at the charts it will often find stocks at or near a new high, or the other common pattern is a “cup-and-saucer” pattern. The new highs tend to just keep roaring upwards, the cup-saucer set-ups I check for nearby resistance to see if I should wait for the next day or once the breakthrough has occurred.
Please let me know of any questions you may have!
Thank you that is very good information to combine with this. I will update you on the results I get.
Take care,
Petra
Thx for the clarification. I should have known that one. Re my plan I’m not as skilled as yourself yet if you want to call me tomorrow anytime after 1:00 Ontario time I can go over my criteria with you and the stocks I found that qualified. I would be interested for you to test it with your expertise. My number is 519 376 8066. Again thx for sharing your knowledge and going the extra mile to help us.
Thank you very much for sharing this strategy with us Mike. I am excited to start using it. I had difficulty with emulating the search. Specifically, in the first parameter, I could not find the value, Industry 40 day MA (price). I inserted Industry 40 day MA RT. Although the search delivered stocks, this parameter seems to be critical but does not correspond to yours. Also, where do you employ the ADX? I use ADX now in my portfolio along with Petra’s EMA3/EMA8. Your Search is great and I’m keen to use it. Any suggestions would be appreciated.
Peter
Peter…I apologize for missing this post and not replying faster!!
Industry Price SMA(40) is a custom variable that you can set-up quite easily with the custom field builder. Click on the tools icon in the top right hand corner, then select custom field builder and it is fairly self-explanatory from there. If you need help setting it up, call product support and I am sure they can get you up to speed very quickly.
Using MA(RT) instead of 40(Price) is a fundamentally different search and you will likely get quite different results. RT will find industries that are showing an increase in momentum but not necessarily industries that have a solid price support level. The sort I used in the search uses RT*CI which will includes the momentum component that way.
It is often said that the broad market trend accounts for about 50% of your success, strong industry pricing 30% and finally the stock itself accounting for the last 20%. By using Industry Price above 40d MA and using the Primary Wave, I am trying to fix the odds at least 80% in my favour! FYI, I ran a backtest with the 40RT sort and the results were ARR=55.63% MDD=6.84% and 49.3% winners. Not bad overall, but inferior results to the base AXS strategy.
Lastly, the ADX is my favourite indicator hands down and I use it for stocks, industries and broad market trend direction. It is especially useful for identifying consolidation before the breakout up/down occurs, thereby allowing you to protect profits or get in at the early stages. In the AXS search the ADX directional crossover is looking for stocks that have crossed into bullish territory in the last 5 days. When I backrests with a shorter look-back period (i.e. 3 days) I didn’t get the same results.
I hope that helps!?!
Thanks for your very detailed presentation and excellent explanations to the various indicators used for the UniSearch and BackTester.
I’m working to duplicate your results.
Would it be possible to show how to build this search when it comes to the Value colomn ?
Thanks
Hi ReJean…I think you are referring to the RV line item? It is simply selecting the RV (Relative Value) parameter from the stocks list of available options and then selecting as the operator the “greater-than-or-equal-to” => then finally using the custom value option enter the number one.
If that isn’t what you are asking for help on, please let me know. Also the help desk line is always an excellent resource and they will happily walk you through any code questions that you may have.
Thanks so much for sharing. I am having trouble . I have created the Unisearch but I cannot find any stocks . I have checked the parameters in my search and they appear to be identical to those in the article.
Any suggestions ?
Thanks,
Hugh
Hugo, on rare occasions this search will come up empty but I suspect you have a parameter slightly off.
Other folks I have worked with on this search sometimes get the Industry MA parameter mixed up and put in Stock MA instead. This is important as the strategy relies on finding Industries performing well and then looking for stocks within that group that are showing strong momemtum signals from the technicals.
Second, make sure you don’t have it excluding any other sectors other than ETF’s, Market and Mining. For all of you mining fans out there, adding them into this strategy (and most others) will significantly reduce performance due to the high volatility of the mining sector.
Third, ensure the volume parameter is greater than 25,000 and not a bigger number or specifically equal to etc. Use the greater-than-or-equal to operator.
Other than that I am not sure what to tell you! I usually find at least 10 stocks except when the whole market is weak, which is a great time NOT to buy anything! Good luck, If you have any more problems let me know.
Hi Michael
I built the srearch and set the setting with the information in your Blog
I came up “TERRIBLE RESULTS” CAN YOU PLEASE SEND ME THE SETTINGS DETAILS ?- i WILL TAKE ANOTHER TRY ( I HAVE DOUBLE CHECKED THE SEARCH AND I HAVE IT CORRECT)
THANKS
BOB HENDY
With 300 variables to get exactly right in every page of the Backtester I am not surprised that you can’t replicate it!!
I will take some screen shots of each backtester settings page and email them to you. Note this is a Canadian only strategy which doesn’t work as well in the US. I haven’t been able to figure out why yet, but I am working on different stop limit assumptions to try and improve results. In essence its a technical study looking for stocks in rising industries with positive technical indicators. Did you make sure you were buying the positions on PW Up and on the close only? That seems to be the most common error, everyone assumes the default to VectorVest buy at open only.
Bob, I am glad to hear you can replicate the results with the screen shots of the backtester set-up that I sent you. If anyone else wants a copy of the complete backtest settings let me know and I can email them to you.
I am using vectorvest india since 2013.. its been 3 years .. now you guys are discontinuing for india. If so please do some arrangement that i can enjoy or provide me tool to calculate rv rt rs p/e and ci
Hi Rani, I was very sorry to hear the India service has been discontinued. Unfortunately with the India database discontinued, I don’t see any way VectorVest can assist you with your request. Thank you for your loyal membership in the past and I hope there comes a time when we can serve you again.