 Canada’s TSX rose today for the 6th straight day, holding on to a slim 11 point gain at the close after soaring out to a 128 point gain in the first hour of trading. Investors seem to be moving back into non-commodity dividend payers including banks and consumer names while pulling back from resource companies.
U.S. markets were mixed with the DJI losing .06% while the S&P 500 closed up .3% and the NASDAQ up .67%. Disney (DIS) was a drag on the DJI, shedding 9% on disappointing earnings.
For a complete Market Report, CLICK HERE
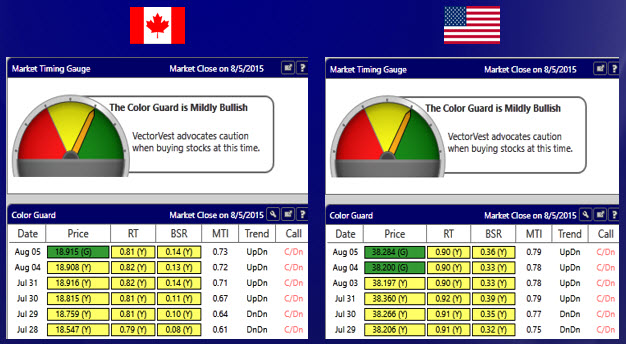
PLEASE NOTE: You’ll notice my video report is a bit wonky today in terms of the Color Guard color in the Price column. At the time of recording my Color Guard video, VectorVest data was not completely updated. I was still seeing the green light in the Price column, the same color it had been the entire day. However, after VectorVest’s final calculations, when I re-opened the program the price of the VVC/CA had actually closed at exactly the same price as yesterday, so the green light was now yellow. We only get a green light if the market closes higher than the previous day.
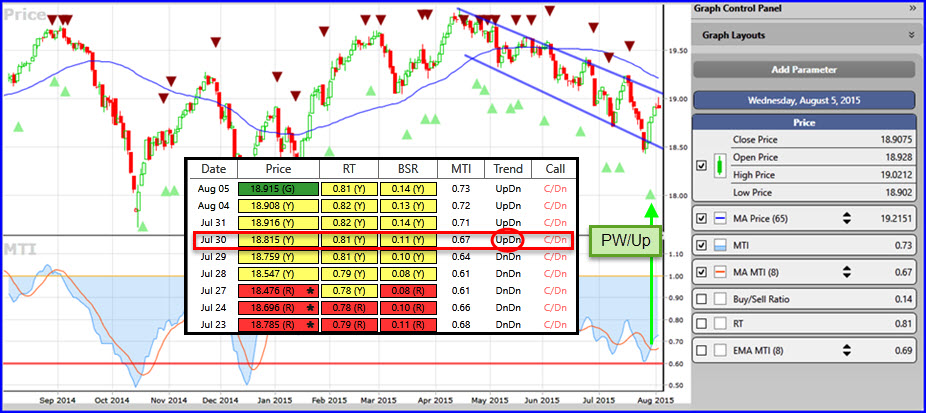
Almost a Green Light, but Caution is advised when buying stocks at this time. The MTI has been rising off what is historically know to be near a market bottom – that a level of 0.60 or below. But notice the resistance overhead shown by the trendlines and 65-day MA on the graph below. Generally, one of the safest times to buy is when the MTI is rising off of those 0.60 and lower levels. However, the market doesn’t always go straight up from there. When there is resistance overhead, It may pause, perhaps even pullback again before starting an upward march. It would be a positive sign if the market can break above the upper trendline shown in the graph below, but until it does, be aware of the potential for a brief pause or even a pullback to test the lower trendline yet again. Make sure the market is rising and your purchase targets are rising the next day before adding any long positions.
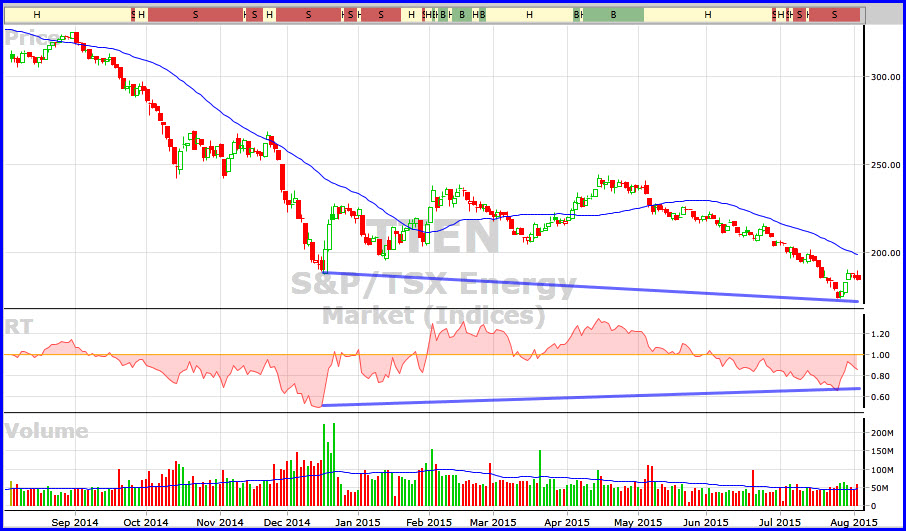
Is There An End In Sight for Petroleum Stocks? The S&P Energy Index (TTEN) has had a rough year and it continues to slide as investors including institutional investors are moving money out until crude inventories fall and price moves higher. Among the biggest 1-year losers in the index are well-known names such as PWT – (-81%); BTE – (-76%); BXE – (-70%); COS – (-69%); ECA – (-60%); and CPG – (- 58%). The one in winner in the index of 51 stocks? Advantage Oil&Gas (AAV), up 27% to $7.38 from $5.80. Suncor is down 13% and Imperial Oil is down 12%. One possible positive sign at least in the short term is the divergence between price and RT in the graph below. Price has hit another lower low, but we can see that RT is displaying a higher low. A positive divergence.
DISCLAIMER: The information contained in this Blog is for education and information purposes only. Example trades should not be considered as recommendations. There are risks involved in investing and only you know your financial situation, risk tolerance, financial goals and time horizon.
Presented by Stan Heller, Consultant, VectorVest Canada