Click on this link to view a replay of Saturday’s International Online Forum.
Buying on pullbacks. We hear about it all the time and it sounds good. But how can we do it consistently and profitably? How do we find the opportunities? And how do we know when to get in and when to get out?
Keynote speaker Wendy Johnson answered our questions and gave us plenty of examples during Saturday’s International Online Forum.
Wendy, a VectorVest subscriber since 2011 and leader of the Arkansas, Little-Rock-Fort Smith User Group, showed Forum attendees a simple, systematic and profitable method for identifying a pullback’s ‘Sweet Spot’. She describes the ‘Sweet Spot’ as, “The buy and sell zone on a chart that can be used to identify possible reversals.”
The sweet spot in Wendy’s set-up is the area between the 10 EMA and 30 EMA. “This where I look for reversals, back to the upside when going long and to the downside when going short.” Below is how she showed it on a chart of Drew Inds (DW):
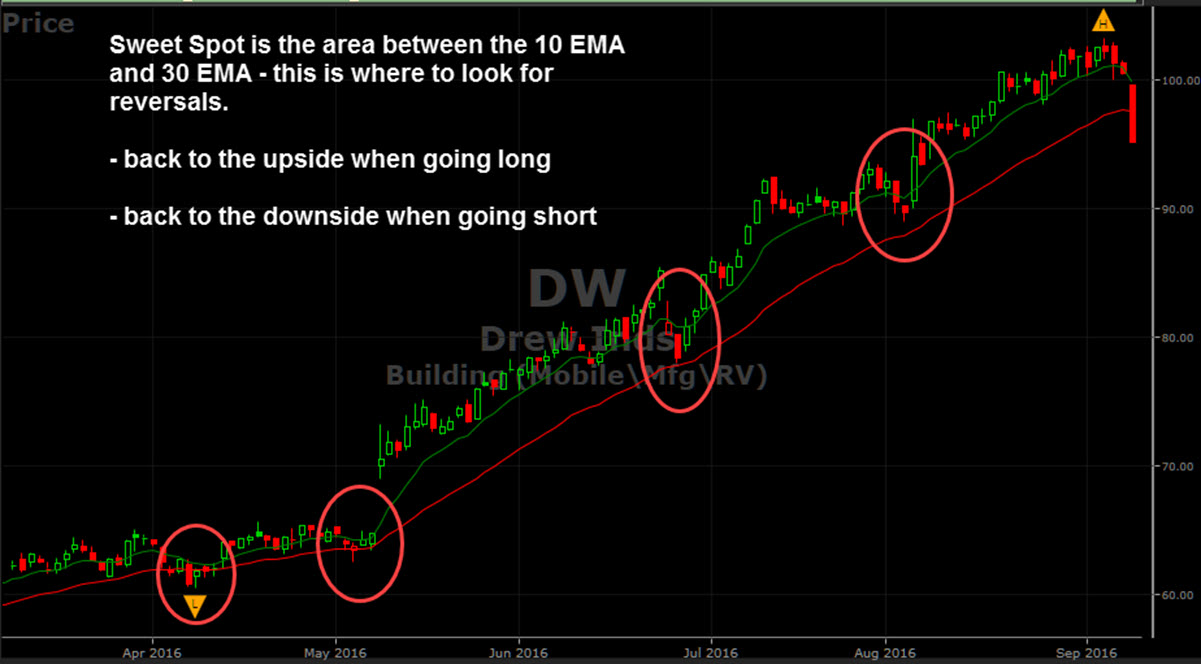
Watch the replay to learn more about how Wendy uses price action, the 10/30 EMA and candlestick reversal patterns to find solid trading opportunities. She shows how she has modified VectorVest’s Bullish Engulfing Candlestick search to look for pullbacks prior to a reversal candlestick. Finally, she describes her risk management techniques such as using limit orders for entering and exiting the trade, taking partial profits early and limiting losses.
The 15-Minute Market Forecast and Tips for How to Manage a Falling Market.
Our look at the Color Guard and the charts shows selling pressure is most likely to continue after Friday’s drop at least early next week in our CA and US markets. In my review during Saturday’s Forum of market conditions I included a few VectorVest tips for managing your trades and your portfolio:
- Follow the daily color guard guidance, but be cautious and defensive because after a lengthy uptrend since February, we are closer to a market top than to a the ‘blast off’ phase of a market bottom.
- Not a good idea to add new positions, but if you do, take smaller positions and be prepared to take quick profits.
- No need to sell everything because of a one-day decline, however, it’s a good idea to act defensively on stocks you own. Be prepared to lock in profits on any signs of weakness such as price stalling out or falling below the 40-MA. A falling EPS and falling RT, especially if it falls below 1.0 is a strong early warning.
- Most important, act decisively on your sell rules. Sell any stock that threatens to turn a gain into a loss, or a small loss into a larger loss.
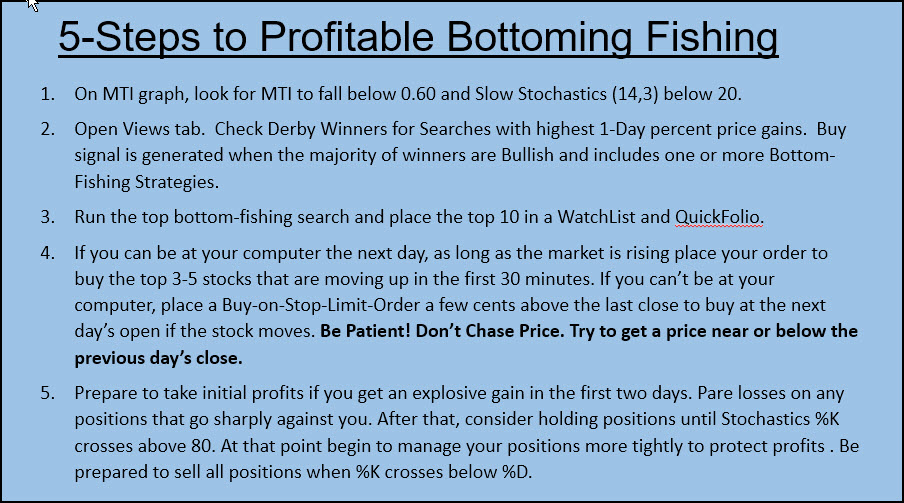
Five Steps to Profitable Bottom-Fishing. In this Forum presentation, I reminded our members to always be prepared for the next Bottom Fishing opportunity. They can be extremely profitable. I set out the steps for how to spot a potential market reversal off a significant bottom, and how to search for the best bottom-fishing opportunities. Key to the method is just how effective the 1-Day Derby Winners list published in the Views is in identifying potential reversals, even before the Primary Wave signal.
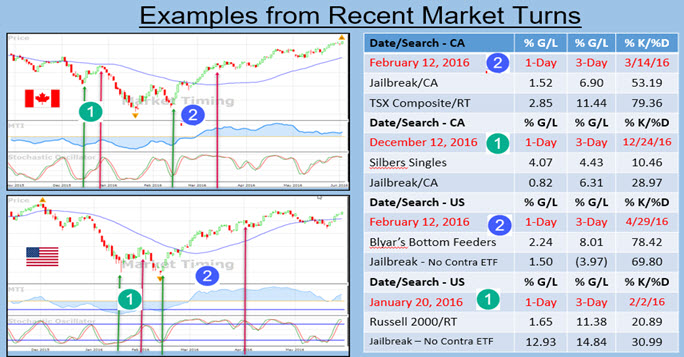
Below is the slide that sets out the five steps. The next image is the slide that shows results from two recent reversal signals, including ones in both CA and US that led to only a short rally, and still delivered solid gains. By the way, one of our members, Irwin B., chatted in a suggestion that might be a good one to do some testing. He suggested it might be a good idea to run all the bottom fishing search in the Derby list and look for matches. Buying the matches could well deliver better results than just the top 3-5 stocks from just one search.
Previous Forum Replays. Click on any of the following links to view a replay of previous International Online Forums:
Posted by Stan Heller, Consultant, VectorVest Canada
DISCLAIMER: The information contained in this Blog is for education and information purposes only. Example trades must not be considered as recommendations. You should always do your own analysis and invest based on your own risk tolerance, investment style, goals and time horizon. There are risks involved in investing and only you know your financial situation, risk tolerance, financial goals and time horizon.